
This article is about the demographic features of the population of Denmark, including population density, ethnicity, education level, health of the populace, economic status, religious affiliations and other aspects of the population.
Ethnic groups
Ethnic minority groups include:
- Inuits (Greenlandic) from the territory of Greenland
- Turks
- Arabs (i.e. Palestinians, followed by Moroccans, Syrians, Lebanese, Yemenis, Egyptians, Iraqis and Jordanians)
- Vietnamese
- Jews
- Chinese
- Pakistanis
- Iranians
- Somalis
- Ethiopians
- Sudanese
- Kurds
- Indians
- Chileans (the most numerous of Latin American nationalities)
- Bosnians (mostly Bosniaks and some Serbs)
- Albanians
Historic minorities
Indigenous ethnic minorities in Denmark include a handful of groups: Germans
Approximately 15,000 persons in Denmark belong to a German minority traditionally referred to as hjemmetyskere meaning "domestic Germans" in Danish, and as Nordschleswiger in German. This minority of Germans hold Danish citizenship and self-identify as ethnic Germans. They continue to use German as their home language. There are also several thousand German citizens and other ethnic Germans residing in Denmark with no historical connection to this group.Faroese and Greenlanders (Inuit)
An estimated 23,000 people in Denmark proper are ethnic Faroese, while 19,000[3] Greenlanders live permanently in Denmark. Many of these use the Faroese and Greenlandic languages, respectively, as their first language.All residents of Rigsfællesskabet (viz. Denmark proper, the Faroe Islands and Greenland) normally hold Danish citizenship, unless they inherit or otherwise receive a foreign citizenship.
Jews
The religiously affiliated Danish Jews number around 7,000. Secular and unaffiliated ethnic Jews in Denmark number several thousand.Roma (Gypsies)
There are approximately 15,000-20,000 Roma people with historical ties to Denmark, excluding recent immigrants and their immediate descendants.
Recent immigrants
Even with increasing immigration in recent decades, the Danish population is still more homogenous than most other western European countries. As of 2009, 526,000 persons (9.5 % of the Danish population) were either themselves immigrants or descendants of recent immigrants. Most of these (54%) have their origins elsewhere in Europe, while the remainder hail largely from Southwest Asia, notably from TurkeyReligion
The Evangelical Lutheran church (Den danske folkekirke) is state-supported and, according to statistics from January 2006, accounts for about 83% of Denmark's religious affiliation. Denmark has had religious freedom guaranteed since 1849 by the Constitution, and numerous other religions are officially recognised, including several Christian denominations, Muslim, Jewish, Buddhist, Hindu and other congregations as well as Asatru, a revival of Scandinavian pagan tradition. The Department of Ecclesiastical Affairs recognizes roughly a hundred religious congregations for tax and legal purposes such as conducting wedding ceremonies. For historical reasons, there is a formal distinction between 'approved' (godkendte) and 'recognised' (anerkendte) congregations of faith. The latter include 11 traditional denominations, such as Roman Catholics, the Reformed Church, the Mosaic Congregation, Methodists and Baptists, some of whose privileges in the country date hundreds of years back. These have the additional rights of having priests appointed by royal resolution and to christen/name children with legal effect.Demographic statistics
Population

CIA World Factbook demographic statistics
The following demographic statistics are from the CIA World Factbook, unless otherwise indicated.Population:
- 5,500,510 (July 2009 est.)
- country comparison to the world: 109
- 0-14 years: 18.1% (male 511,882/female 485,782)
- 15-64 years: 65.8% (male 1,817,800/female 1,798,964)
- 65 years and over: 16.1% (male 387,142/female 498,940) (2009 est.)
- total: 40.5 years
- male: 39.6 years
- female: 41.3 years (2009 est.)
- 0.28% (2009 est.)
- country comparison to the world: 175
- 10.54 births/1,000 population (2009 est.)
- country comparison to the world: 184
- 10.22 deaths/1,000 population (July 2009 est.)
- country comparison to the world: 57
- 2.48 migrant(s)/1,000 population (2009 est.)
- country comparison to the world: 32
- urban population: 87% of total population (2008)
- rate of urbanization: 0.5% annual rate of change (2005-10 est.)
- at birth: 1.06 male(s)/female
- under 15 years: 1.05 male(s)/female
- 15-64 years: 1.01 male(s)/female
- 65 years and over: 0.78 male(s)/female
- total population: 0.98 male(s)/female (2009 est.)
- total: 4.34 deaths/1,000 live births
- country comparison to the world: 203
- male: 4.39 deaths/1,000 live births
- female: 4.29 deaths/1,000 live births (2009 est.)
- total population: 78.3 years
- country comparison to the world: 45
- male: 75.96 years
- female: 80.78 years (2009 est.)
- 1.74 children born/woman (2009 est.)
- country comparison to the world: 166
- 0.2% (2007 est.)
- country comparison to the world: 104
- 4,800 (2007 est.)
- country comparison to the world: 124
- fewer than 100 (2003 est.)
- country comparison to the world: 129
- noun: Dane(s)
- adjective: Danish
- Scandinavian
- Inuit
- Faroese
- German
- Turkish
- Iranian
- Somali
- Evangelical Lutheran 95%
- Other Christian (includes Protestant and Roman Catholic) 3%
- Muslim 2%
- Danish
- Faroese
- Greenlandic (an Inuit dialect)
- German (small minority)
Literacy:
- definition: age 15 and over can read and write
- total population: 99%
- male: 99%
- female: 99% (2003 est.)
- total: 17 years
- male: 16 years
- female: 17 years (2006)
- 8.3% of GDP (2005)
- country comparison to the world: 12
SWEDEN
The demographics of Sweden is about the demographic features of the population of Sweden, including population growth, population density, ethnicity, education level, health of the populace, economic status, religious affiliations and other aspects of the population. In addition to the ethnic Swedish majority, Sweden has historically had smaller minorities of Sami people in the northernmost parts of the country while Finns (at 5% of the total population) are most prominent in the Mälardalen and in the north of Sweden.
The demographic profile of Sweden has changed significantly as a result of unfettered immigration since the 1970s.
Population statistics
- Population: 9,316,256 (As of 31 August 2009)
- Annual population growth rate: 0.158% (As of 2010)
- Net migration rate: 1.66 migrant(s)/1,000 population (As of 2010 est.)
- Total fertility rate: 1.67 children born/woman (2010 est.)
- Infant mortality rate: 2.75 deaths/1,000 live births (As of 2010 est.)
- Life expectancy at birth: 80.86 years
- Male: 78.59 years
- Female: 83.26 years (As of 2010 est.)
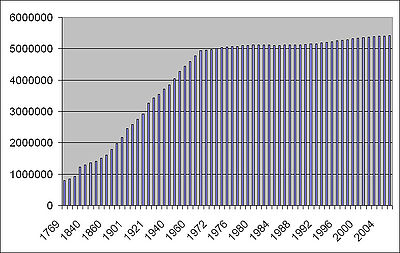
Population of Sweden, 1961 to 2003. The population increased from 7.5 to 8.3 million during the 1960s to 1970s. After a phase of steadyness during the early 1980s, the population grew further from 8.3 to 8.8 million during 1987 to 1997, followed by another phase of stagnation (followed by another growth phase from 8.8 to 9.3 million over 2004 to 2010).


Estimated birth rate (blue) and death rate in Sweden for the period of 1735 to 2000. The graph indicates strong population growth for the period of 1800 to 1970, and a beginning population decline from the 1980s
Sweden household census 1990
- Total number of households: 3 830 037
- Inv on average per household: 2.1
- Number of children 0–18 years on average per household: 1.72
For the population from household incounting date was the total population of Sweden estimated to be 8.526 million of them 8.043 million people came from all 3.830 million household's. (1990)
Ethnicity
Beside the Swedes, the Sweden-Finns are the largest ethnic minority comprising approximately 50,000 along the Swedish-Finnish border, and 450,000 first and second generation immigrated ethnic Finns. Also in the farthest North a small population of Samis live. More than 100,000 Assyrians/Syriacs live in Sweden, including around 40,000 in Stockholm County.CIA World Factbook demographic statistics
For the latest statistics, see this country's entry in the CIA World Factbook
Age structure
- 0–14 years: 15.7% (male 733,597; female 692,194)
- 15–64 years: 65.5% (male 3,003,358; female 2,927,038)
- 65 years and over: 18.8% (male 753,293; female 950,171) (As of 2010 est.)
Net migration rate
- 1.66 migrant(s)/1,000 population (As of 2010 est.)
Sex ratio
- at birth: 1.061 male(s)/female
- under 15 years: 1.06 male(s)/female
- 15–64 years: 1.02 male(s)/female
- 65 years and over: 0.8 male(s)/female
- total population: 0.98 male(s)/female (As of 2010 est.)
Infant mortality rate
- total: 2.75 deaths/1,000 live births
Life expectancy at birth
- total population: 80.86 years
- male: 78.59 years
- female: 83.26 years (As of 2010 est.)
Total fertility rate
- 1.67 children born/woman (As of 2010 est.)
Literacy
- definition: age 15 and over can read and write
- total population: 99% (As of 2003 est.)
Migration
Immigration
Main article: Immigration to Sweden

- Finland (172,218)
- Former Yugoslavia (152,268)
- Iraq (117,919)
- Poland (67,518)
- Iran (59,922)
- Germany (47,803)
- Denmark (46,002)
- Norway (43,819)
- Turkey (40,766)
- Somalia (31,734)
History
World War II
Immigration increased markedly with World War II. Historically, the most numerous of foreign born nationalities are ethnic Germans from Germany and other Scandinavians from Denmark and Norway. In short order, 70,000 war children were evacuated from Finland, of which 15,000 remained in Sweden. Also, many of Denmark's nearly 7,000 Jews who were evacuated to Sweden decided to remain there.A sizable community from the Baltic States (Estonia, Latvia and Lithuania) arrived during the Second World War.
During the 1950s and 1960s, the recruitment of immigrant labor was an important factor of immigration. The Nordic countries signed a trade agreement in 1952, establishing a common labour market and free movement across borders. This migration within the Nordic countries, especially from Findland to Scandinavia, was essential to create the tax-base required for the expansion of the strong public sector now charactreristic of Scandinavia. This continued until 1967, when the labour market became saturated, and Sweden introduced new immigration controls.
On a smaller scale, Sweden took in political refugees from Hungary and the former Czechoslovakia after their countries were invaded by the Soviet Union in 1956 and 1968 respectively. Some tens of thousands of American draft dodgers from the Vietnam War in the 1960s and 1970s also found refuge in Sweden.
Contemporary immigration
Since the early 1970s, immigration to Sweden has been mostly due to refugee migration and family reunification from countries in the Middle East and Latin America.The first group of Assyrians/Syriacs moved to Sweden from Lebanon in 1967. Many of them live in Södertälje (Stockholm), also known as Mesopotälje (after Mesopotamia). There are also around 40,000 Roma in Sweden.
Immigration of Iraqis has increased dramatically during the Iraq War, during 2003 to 2007. A total of 8,951 Iraqis came to Sweden in 2006, accounting for 45% of the entire Iraqi migration to Europe. By 2007, the community of Iraqis in Sweden numbered above 70,000. In 2008, Sweden introduced tighter rules on asylum seeker
Language
The Swedish language is by far the dominating language in Sweden, and is used by the government administration.
The indigenous Finno-Ugric languages were repressed well into the 1960s.[citation needed] Since 1999 Sweden has five officially recognized minority languages: Sami, Meänkieli, Standard-Finnish, Romani chib and Yiddish.
The Sami language, spoken by about 7,000 people in Sweden, may be used in government agencies, courts, preschools and nursing homes in the municipalities of Arjeplog, Gällivare, Jokkmokk and Kiruna and its immediate neighbourhood.
Similarly, Finnish and Meänkieli can be used in the municipalities of Gällivare, Haparanda, Kiruna, Pajala and Övertorneå and its immediate neighbourhood. Finnish is also official language, along with Swedish, in the city of Eskilstuna[citation needed].
During the mid to late 20th century, immigrant communities brought other languages, among others being Danish, Turkish, Serbo-Croatian, Arabic, Neo-Aramaic
Religion
Although only one fifth of Swedes in one investigation chose to describe themselves as believing in God, the majority (78%) of the population belongs to the Church of Sweden, the Lutheran church that separated from the state in 2000. This is because until recently, those who had family members in the church automatically became members at birth.[citation needed] Other Christian denominations in Sweden include Roman CatholicCatholic Church of Sweden), Orthodox, Baptist, and other evangelical Christian churches (frikyrkorShamanism persisted among the Sami people up until the 18th century, but no longer exists in its traditional form as most Sami today belong to the Lutheran church. There are also a number of Muslims, Buddhists, Bahá'í and Jews in Sweden, mainly from immigration = "free churches"). (see

